
Housing’s Role in Portfolio Construction
 Share on LinkedIn
 Share via Email
 Save as PDF
Earlier this year, I spoke on a panel at a real estate conference in Austin, Texas. I was asked a question that initially seemed straightforward, but it prompted a more careful look at how housing fits within portfolios today.
My answer: the role itself has not changed. Housing does not serve a singular purpose in portfolios. Instead, it functions as a diversifying exposure across multiple asset classes within a multi‑asset portfolio. What has changed is which housing‑related investments present opportunity in today’s real estate market. Several structural forces, including migration and housing affordability, are shaping the current opportunity set.
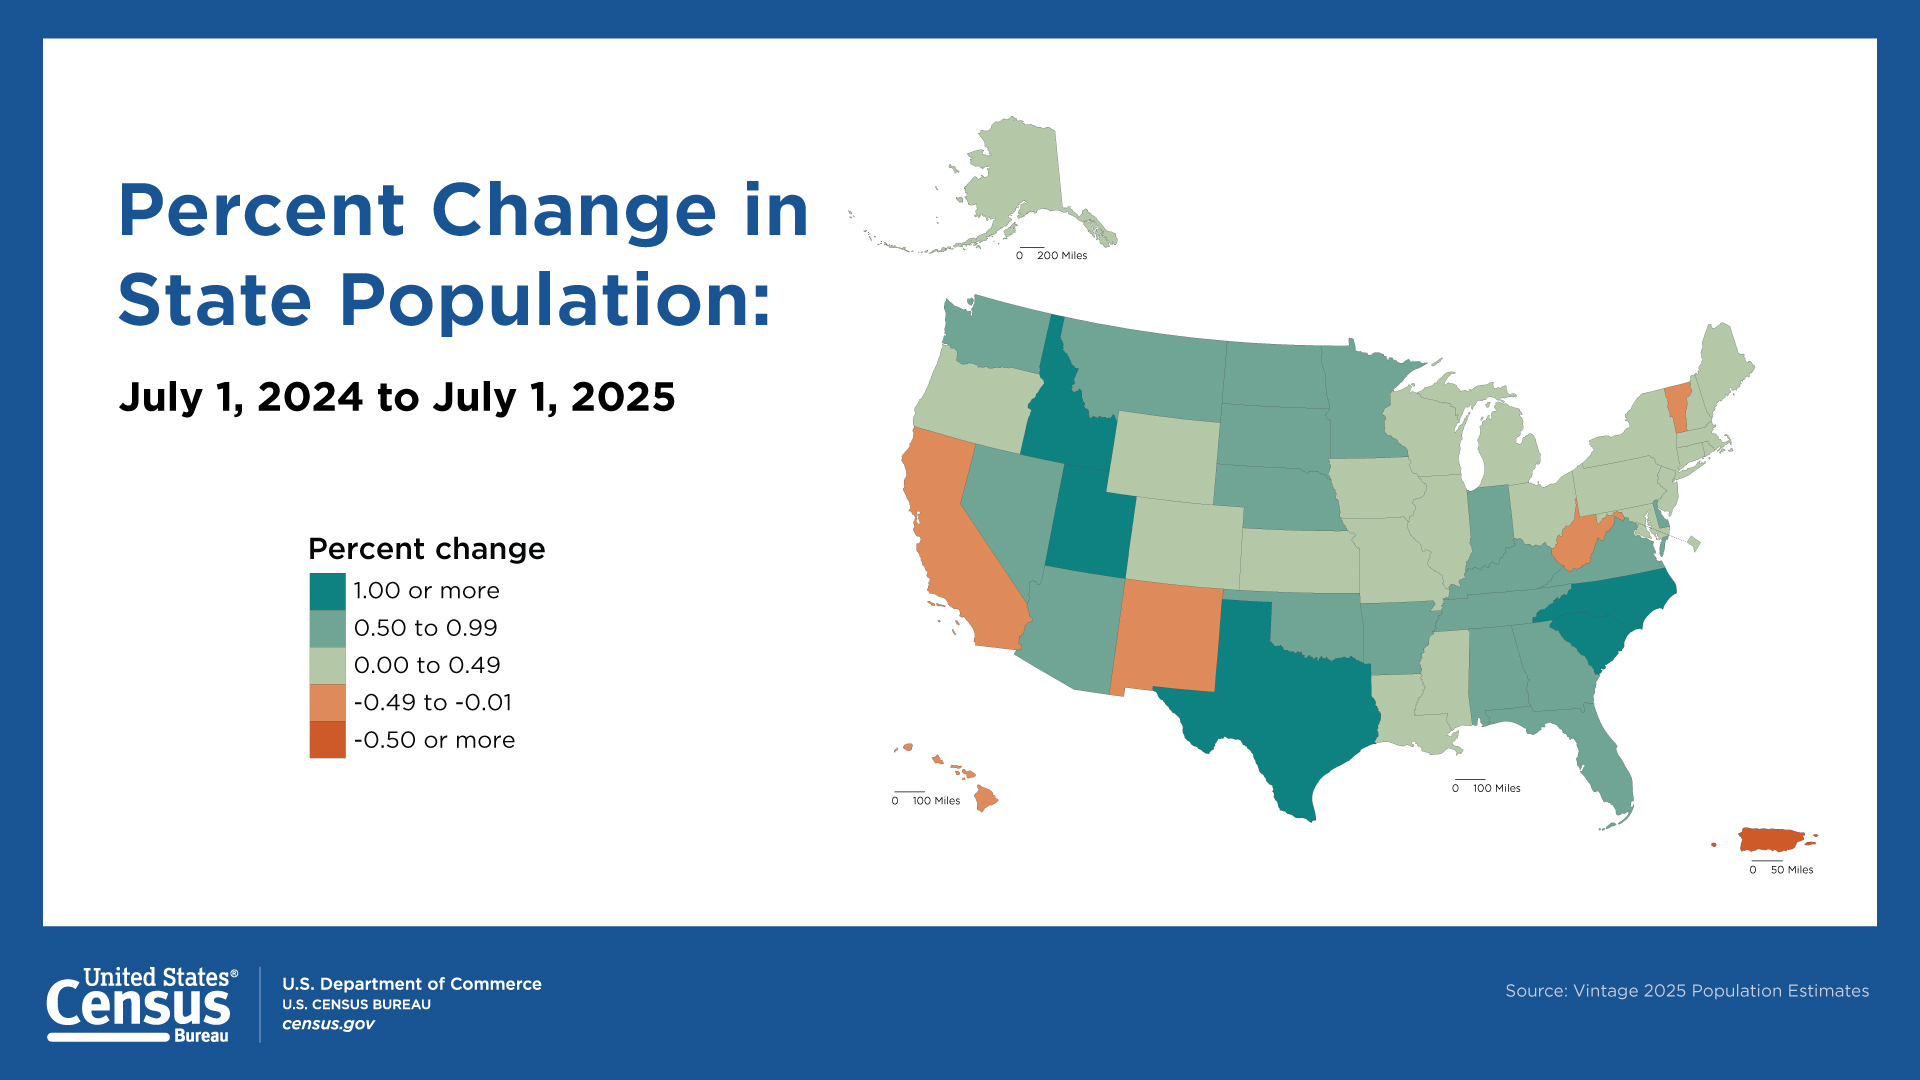
The illustration below from the United States Census Bureau shows that people continue to move from states that tend to have higher taxes to states with lower taxes, often following job growth. This is not a short‑term trend, and it is particularly visible in housing.  Figure 1: Data as of July 1, 2025
The second force is affordability. The chart below from the Federal Reserve Bank of Atlanta shows that median household income in the United States remains well below the income required to qualify for homeownership. 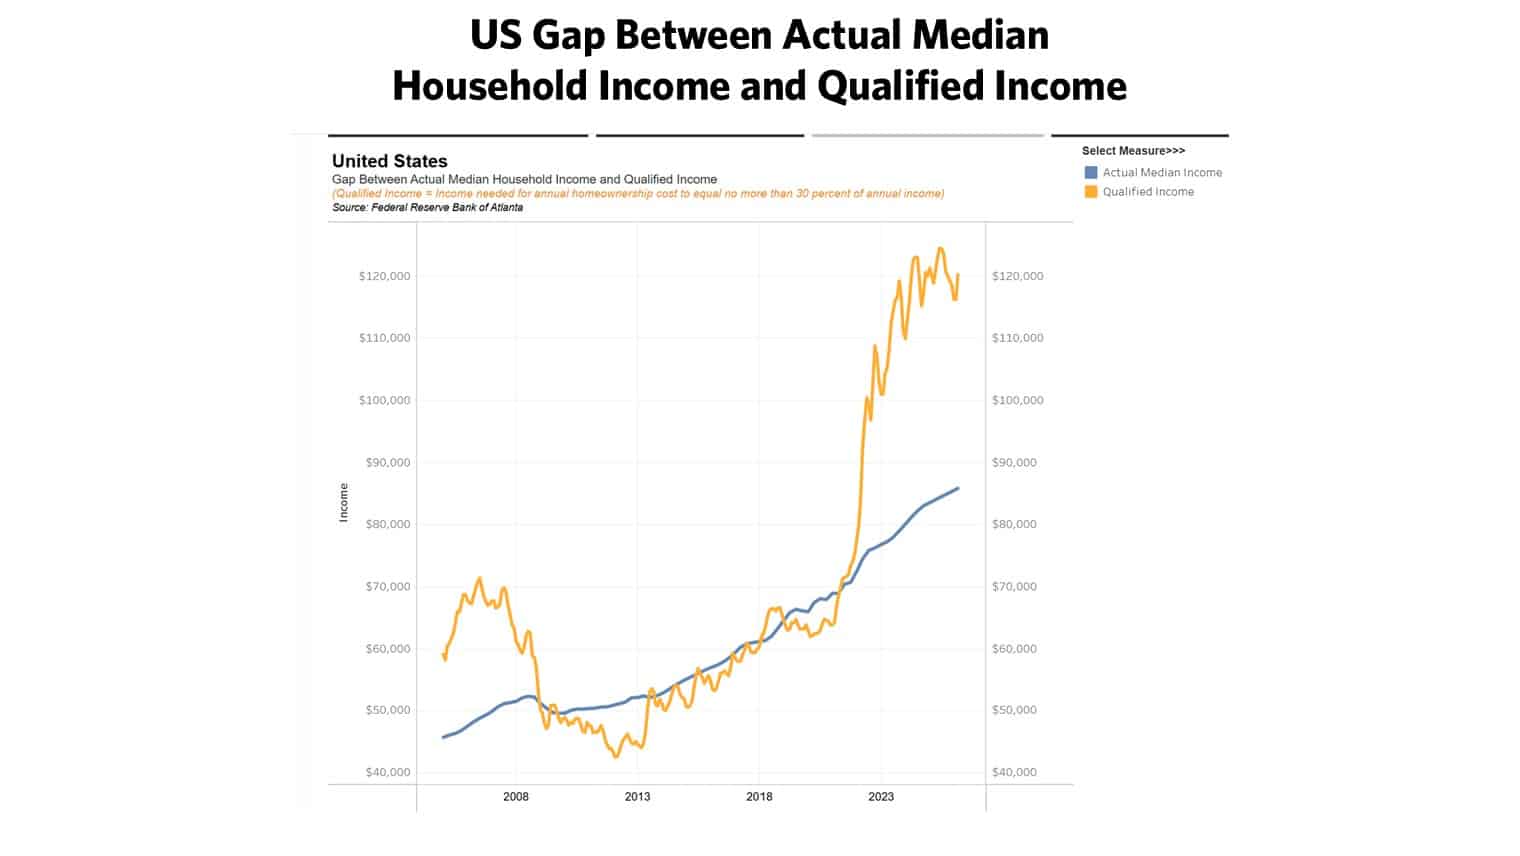 Figure 2: Data as of May 8, 2026
Rising housing costs create affordability pressure, but as affordability tightens, housing demand does not disappear. People may delay buying, rent longer, or adjust how they live, but they cannot opt out of housing altogether.
Against that backdrop, I think of housing‑related investments as a toolkit. Housing can complement private equity, provide an alternative form of private credit exposure, or serve as underlying collateral within fixed income allocations.
As a complement to private equity exposure, multifamily housing across the Southeastern and Southwestern United States, including Texas, has drawn significant attention in recent years due in part to changes in supply. After a multi‑year supply wave sent many investors searching for opportunity elsewhere, completions of new apartment complexes are now declining.
While the transition is uneven across markets, existing supply is being absorbed and new supply is slowing. In parts of Texas, multifamily properties can be acquired below replacement cost, even as demand for apartments remains resilient.
Senior housing equity also stands out as a complement to private equity. The population aged 80 and older continues to grow, while new supply has struggled to keep pace, and occupancies are rebounding. Costs in senior housing are largely fixed. Labor, services, and facilities expenses do not easily scale down when occupancy declines, but that same structure creates operating leverage as occupancy improves. Even modest gains can lead to a meaningful increase in net operating income.
Housing can also serve as a form of private credit exposure. In 2026, some private credit strategies have faced increased scrutiny as concerns have emerged around asset‑light collateral, including software‑backed loans vulnerable to disruption. In some cases, investor concerns about repayment have contributed to heightened redemption activity.
Many of these strategies share common characteristics. Returns are often driven by ordinary income, which can be relatively tax inefficient for taxable investors. Underlying collateral may be limited, particularly when borrowers rely on technology that could become obsolete. Some strategies also employ fund‑level leverage on top of loans to already levered borrowers.
In contrast, senior housing loans tend to be backed by tangible assets with long, useful lives. While an operating business sits on top of the real estate and can introduce complexity, that same complexity can enhance return potential without the use of fund‑level leverage. Operational challenges such as staffing, reimbursement, or execution issues can affect performance, but these issues are often addressable. Even when they are not, the underlying asset remains.
In some cases, senior housing loans may also offer tax advantages. Certain loans qualify as tax‑exempt municipal bonds, which can improve after‑tax outcomes. Together, these characteristics make senior housing loans a differentiated component within portfolios.
Housing‑related investments can also play a role in fixed income allocations. Single‑family homes often serve as attractive loan collateral because, over time, home values have generally increased.
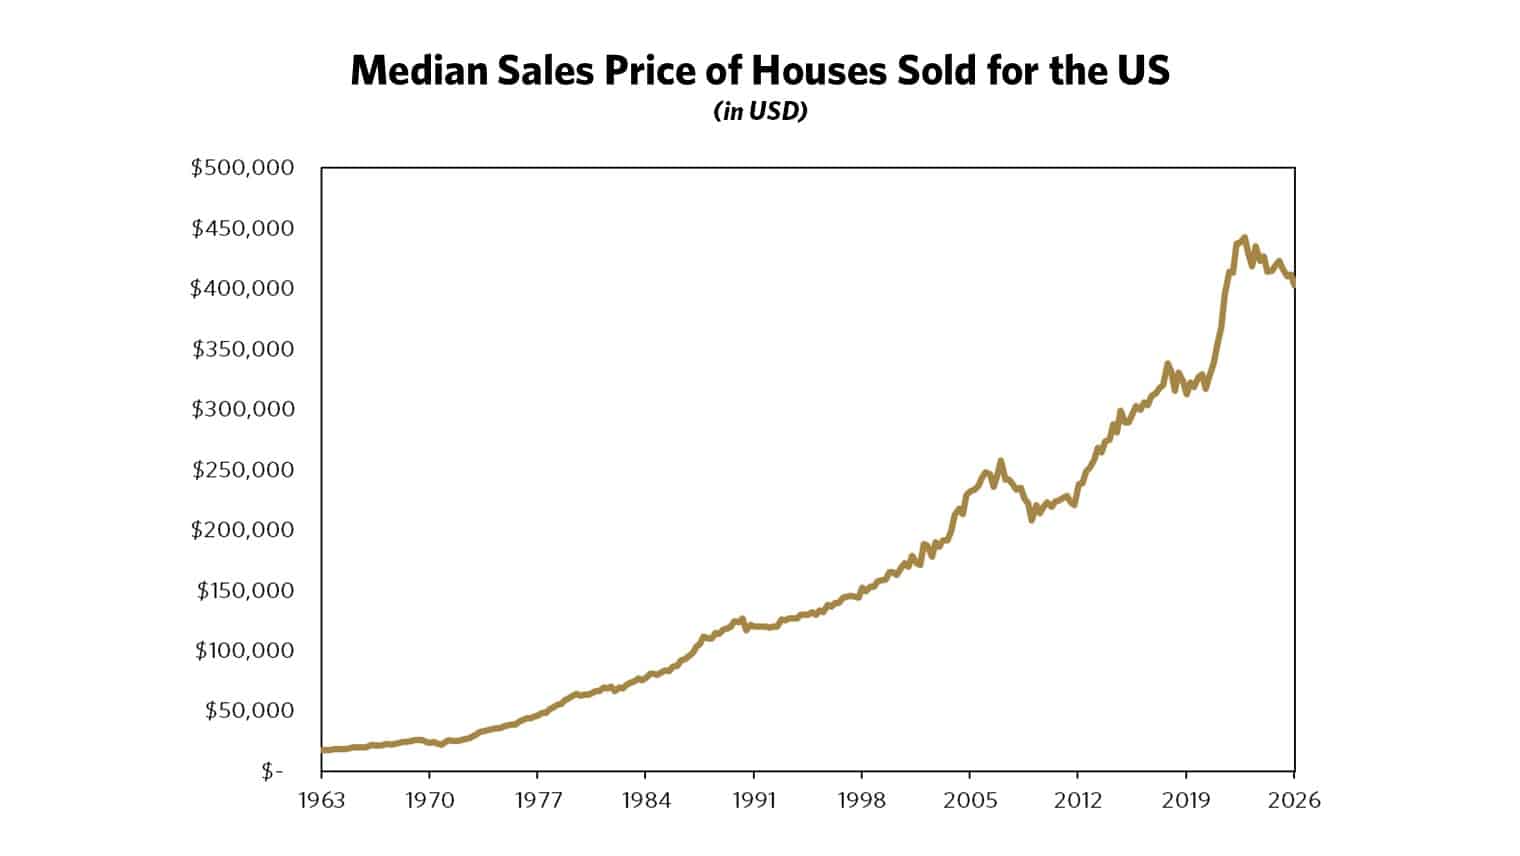
Figure 3: Data as of March 31, 2026
Rising home values build borrower equity and provide an additional buffer for lenders. This dynamic is particularly relevant in non‑agency, mortgage‑backed securities, where borrower equity and home price trends directly influence credit performance and recovery values.
In agency mortgage‑backed securities, credit risk is largely addressed through government or agency guarantees. As a result, interest rate and prepayment uncertainty tend to drive changes in expected outcomes. After a period of elevated interest‑rate volatility, yields on agency mortgage‑backed securities are now broadly comparable to those available on investment‑grade corporate bonds, offering relative value given the lower default risk.
Today, I hold the same view I shared during my panel discussion in Austin: housing-related investments do not serve a single purpose in portfolio construction. They can provide diversification across private credit, private equity, and fixed income allocations. The opportunity set continues to be shaped by durable forces such as migration, affordability, and demographics. Migration is redirecting demand toward growing markets, while affordability pressures and demographic shifts are influencing how households access housing across rental, senior, and other property types. Together, these dynamics underscore housing’s versatility and relevance in today’s market across rental, senior, and other property types. That combination is what makes housing such a versatile sector, and especially attractive in today’s market.
General Disclosures: This article was compiled by Tolleson Wealth Management (“TWM”). It has been prepared and is distributed solely for informational purposes only and is not a solicitation or an offer to buy a security or instrument or to participate in any trading strategy. This content may not be reproduced, distributed, or transmitted, in whole or part, by any means, without written permission from TWM. If you have any questions regarding this presentation, please contact your TWM representative.
Sources:
- Figure 1: United States Census Bureau. State Population Percent Change Map. 2026, https://www.census.gov/content/dam/Census/library/visualizations/2026/demo/state-population-percent-change-map.jpg. Accessed 14 May 2026.
- Figure 2: Federal Reserve Bank of Atlanta. Home Ownership Affordability Monitor: Metro View. Tableau Public, https://public.tableau.com/app/profile/atlantafed/viz/HOAMMetroView/Affordability. Accessed 14 May 2026.